Greenhouse Fleet Platform → Cloud
A cloud-native platform for visualizing greenhouse fleets and applying crop-specific setpoints.
- Go
- React
- Service-Oriented
- Event-Driven
- OIDC
- PostgreSQL
- TimescaleDB
- MQTT
- Prometheus
Problem
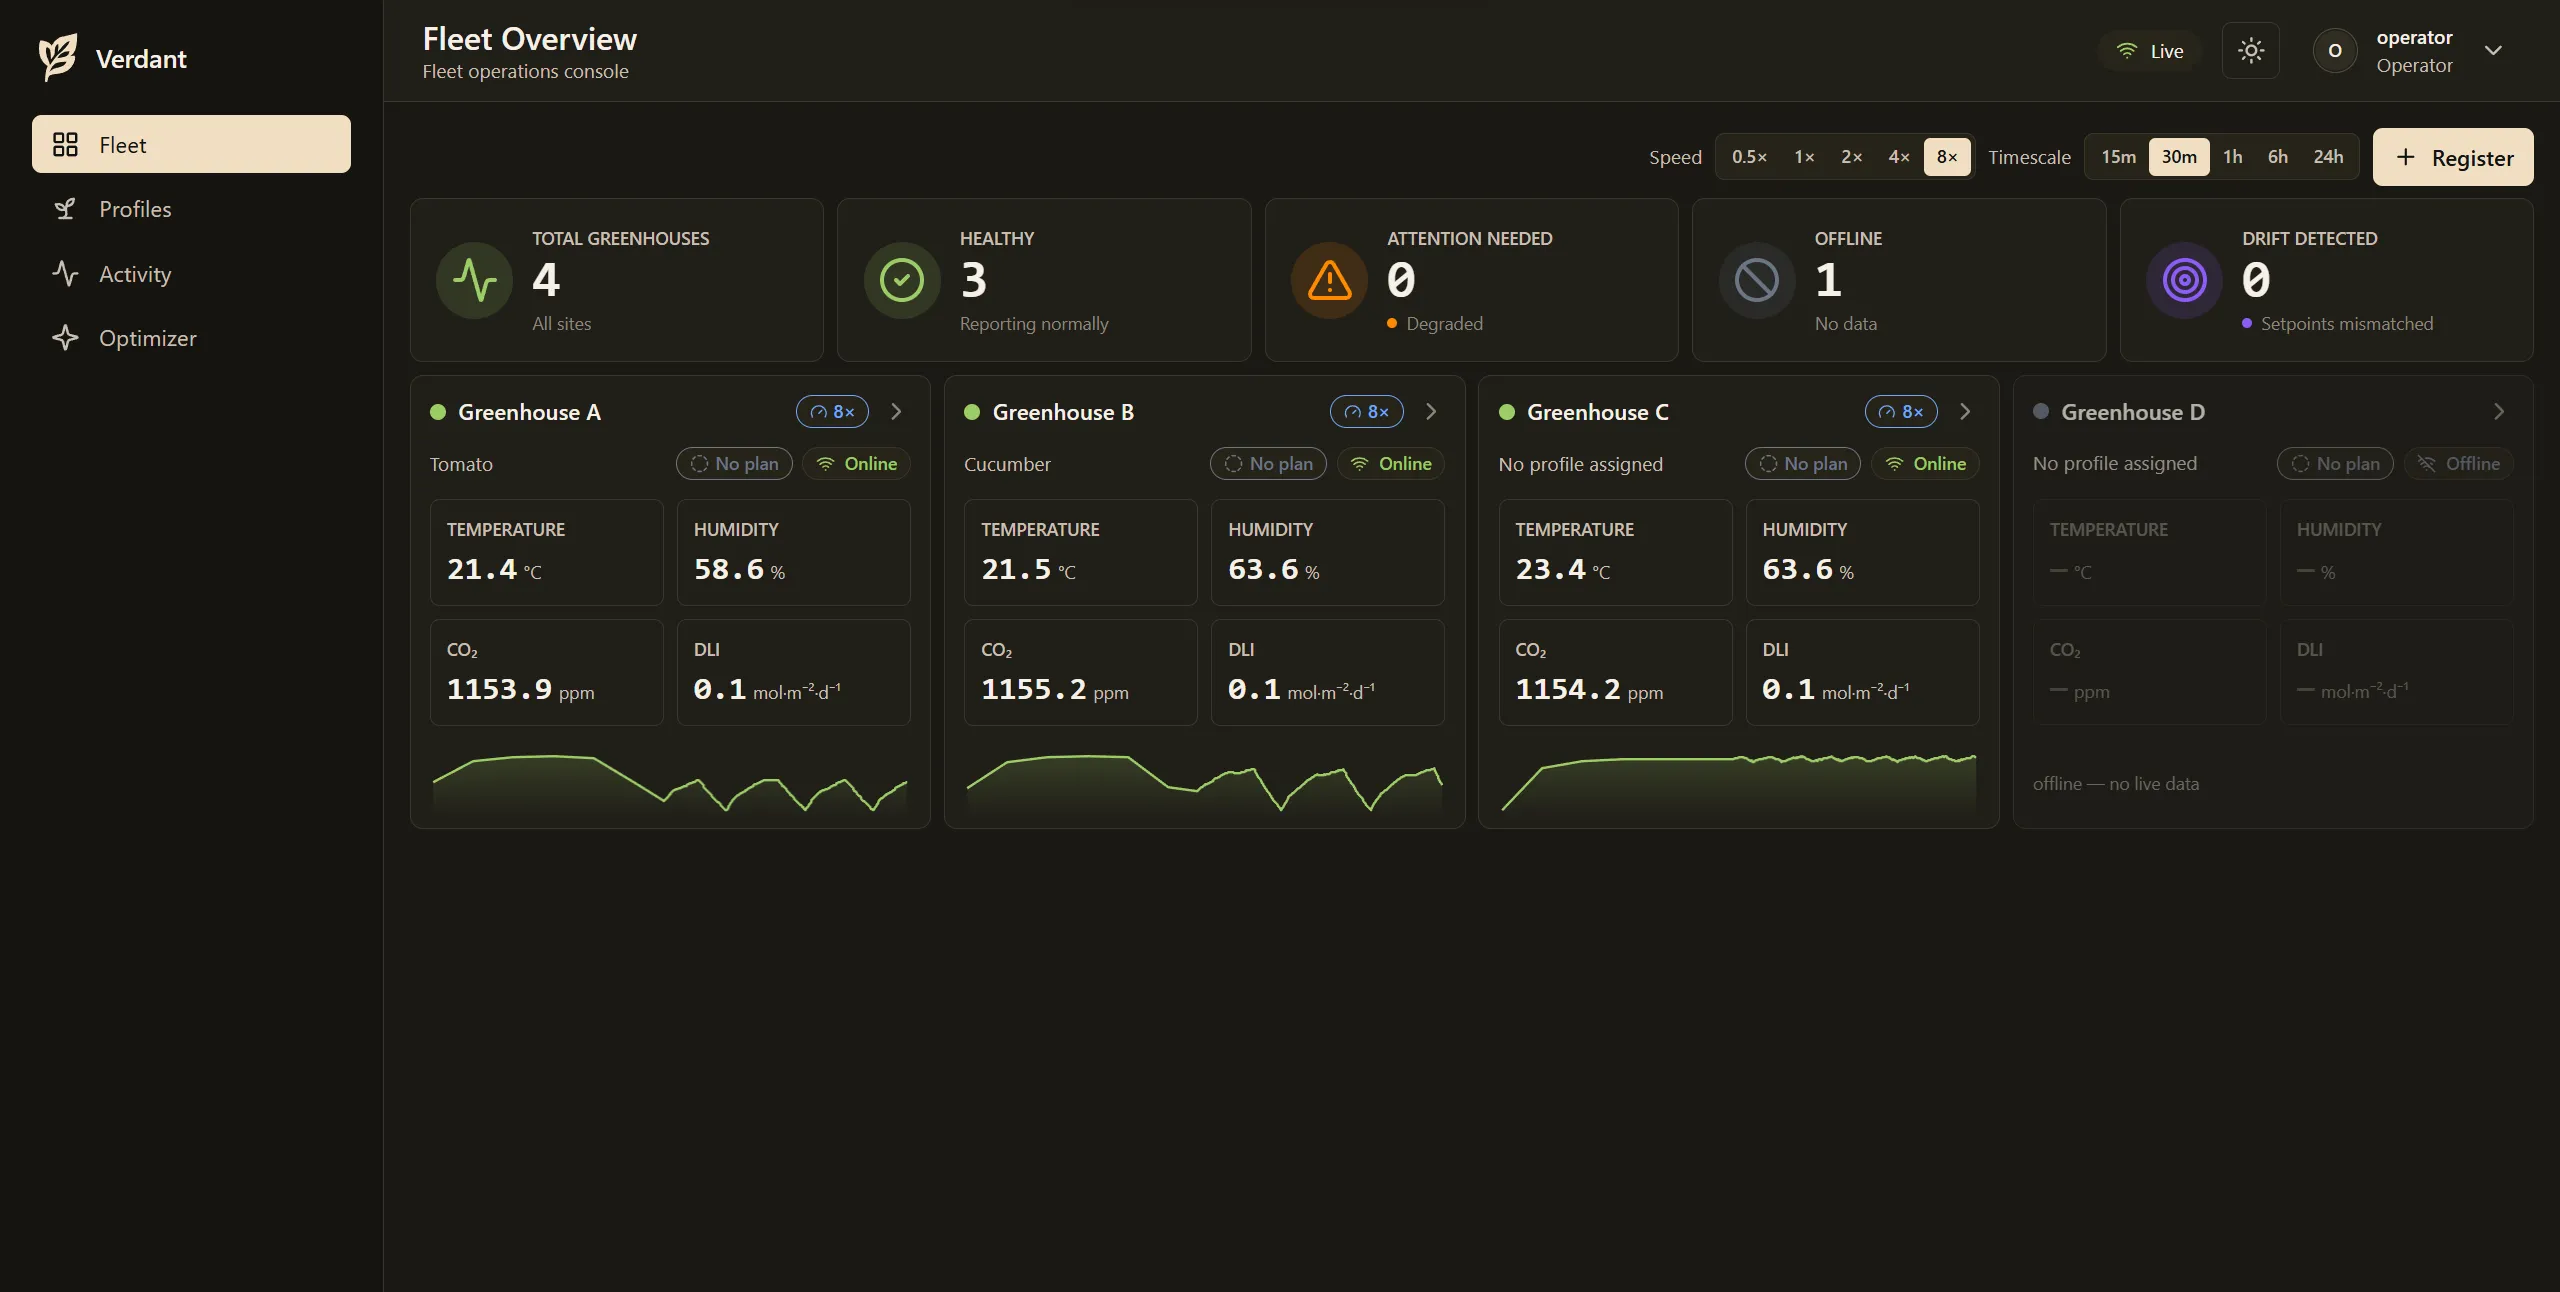
Operating several greenhouses requires more than a collection of local control screens. An operator needs one trustworthy place to register each greenhouse, understand its live condition, define what a crop needs at each growth stage, and know whether that intent actually reached the house.
I built the fleet platform as that operational layer. It receives telemetry from each greenhouse, persists the history, streams current state to the dashboard, and translates crop-profile assignments into the target setpoints each greenhouse should hold. Most importantly, it retains the intended state and reconciles it when a controller reconnects or drifts from the platform’s record.
The result is a single operator surface for a fleet without making the platform a remote actuator-control system. It is cloud-native in its deployment and operations model—containerized, observable, and designed to scale by service role—while keeping its infrastructure boundaries provider agnostic.
Complexity
Coordinating Intent Across Independent Greenhouses
Every greenhouse has its own connection state, telemetry history, crop assignment, and current controller configuration. The platform must distinguish between what it last observed, what the operator intends, and what it has successfully delivered. Treating a successful HTTP response as the whole story would make reconnects and local changes invisible.
| Concern | Platform response |
|---|---|
| Fleet visibility | A registry maps each greenhouse identity to its MQTT topic root and controller endpoint, while live state feeds fleet-level status. |
| Telemetry at different rates | MQTT data is ingested through bounded buffers, stored as time series, and fanned out over WebSockets without making the dashboard a dependency of ingestion. |
| Crop intent | A crop profile and growth-stage assignment resolve to a concrete setpoint bundle for one greenhouse. |
| Delivery uncertainty | Intended state is persisted with provenance, then re-applied on reconnect and compared against reported state to surface drift. |
History and Live State Have Different Jobs
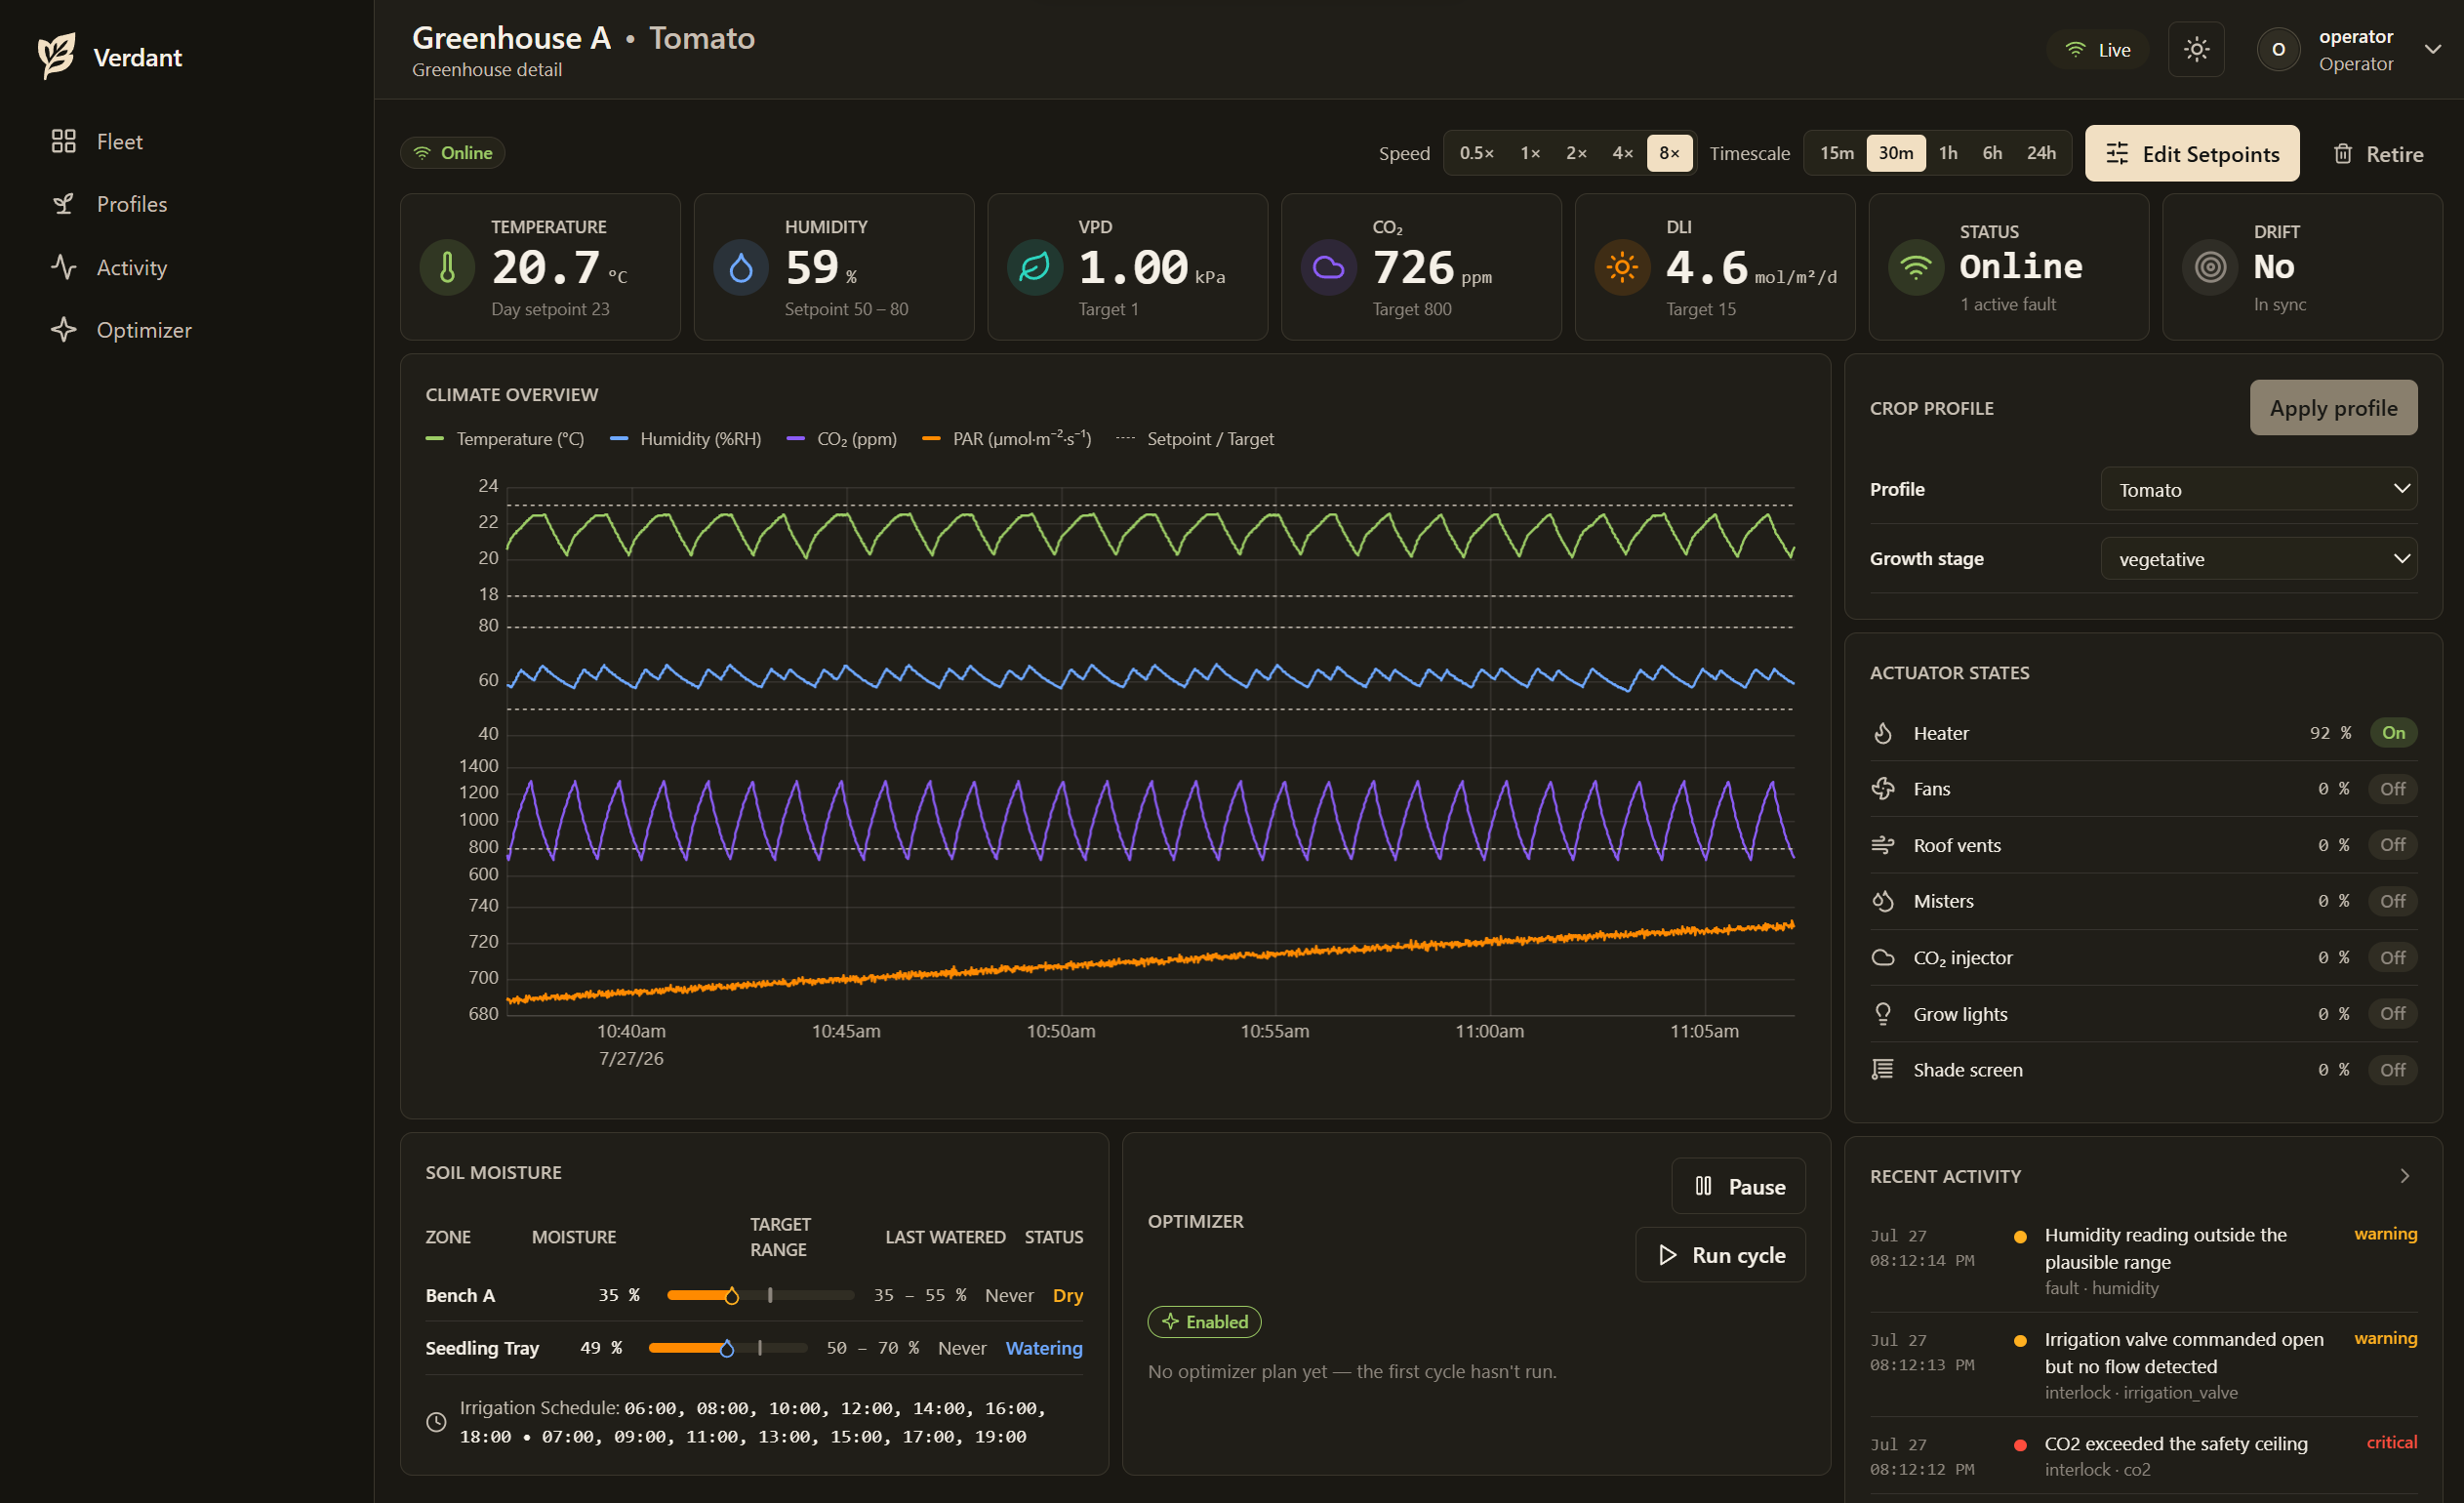
The dashboard needs both a current answer and an explanation of how the greenhouse arrived there. The platform keeps a lightweight in-memory fleet view for current status while writing telemetry and events to TimescaleDB for ranges, analytics, and the activity feed. WebSocket frames keep the interface live; REST provides the durable, queryable view.
This split also makes overload behavior explicit. Ingestion uses bounded queues and sheds the oldest intermediate frames if storage falls behind. That creates an observable loss of historical resolution rather than unbounded memory growth or a stalled platform.
Architectural Design
The Platform Is the Coordination Hub
The Go API is the system’s operational hub. It receives controller telemetry over MQTT, stores it in TimescaleDB, serves the React dashboard through REST and WebSockets, and sends only resolved setpoints back through the controller’s REST boundary. nginx provides one browser-facing entry point, while OIDC roles gate write operations. The topology uses portable services and standard protocols, so it can run on cloud infrastructure without coupling the platform to provider-specific managed services.
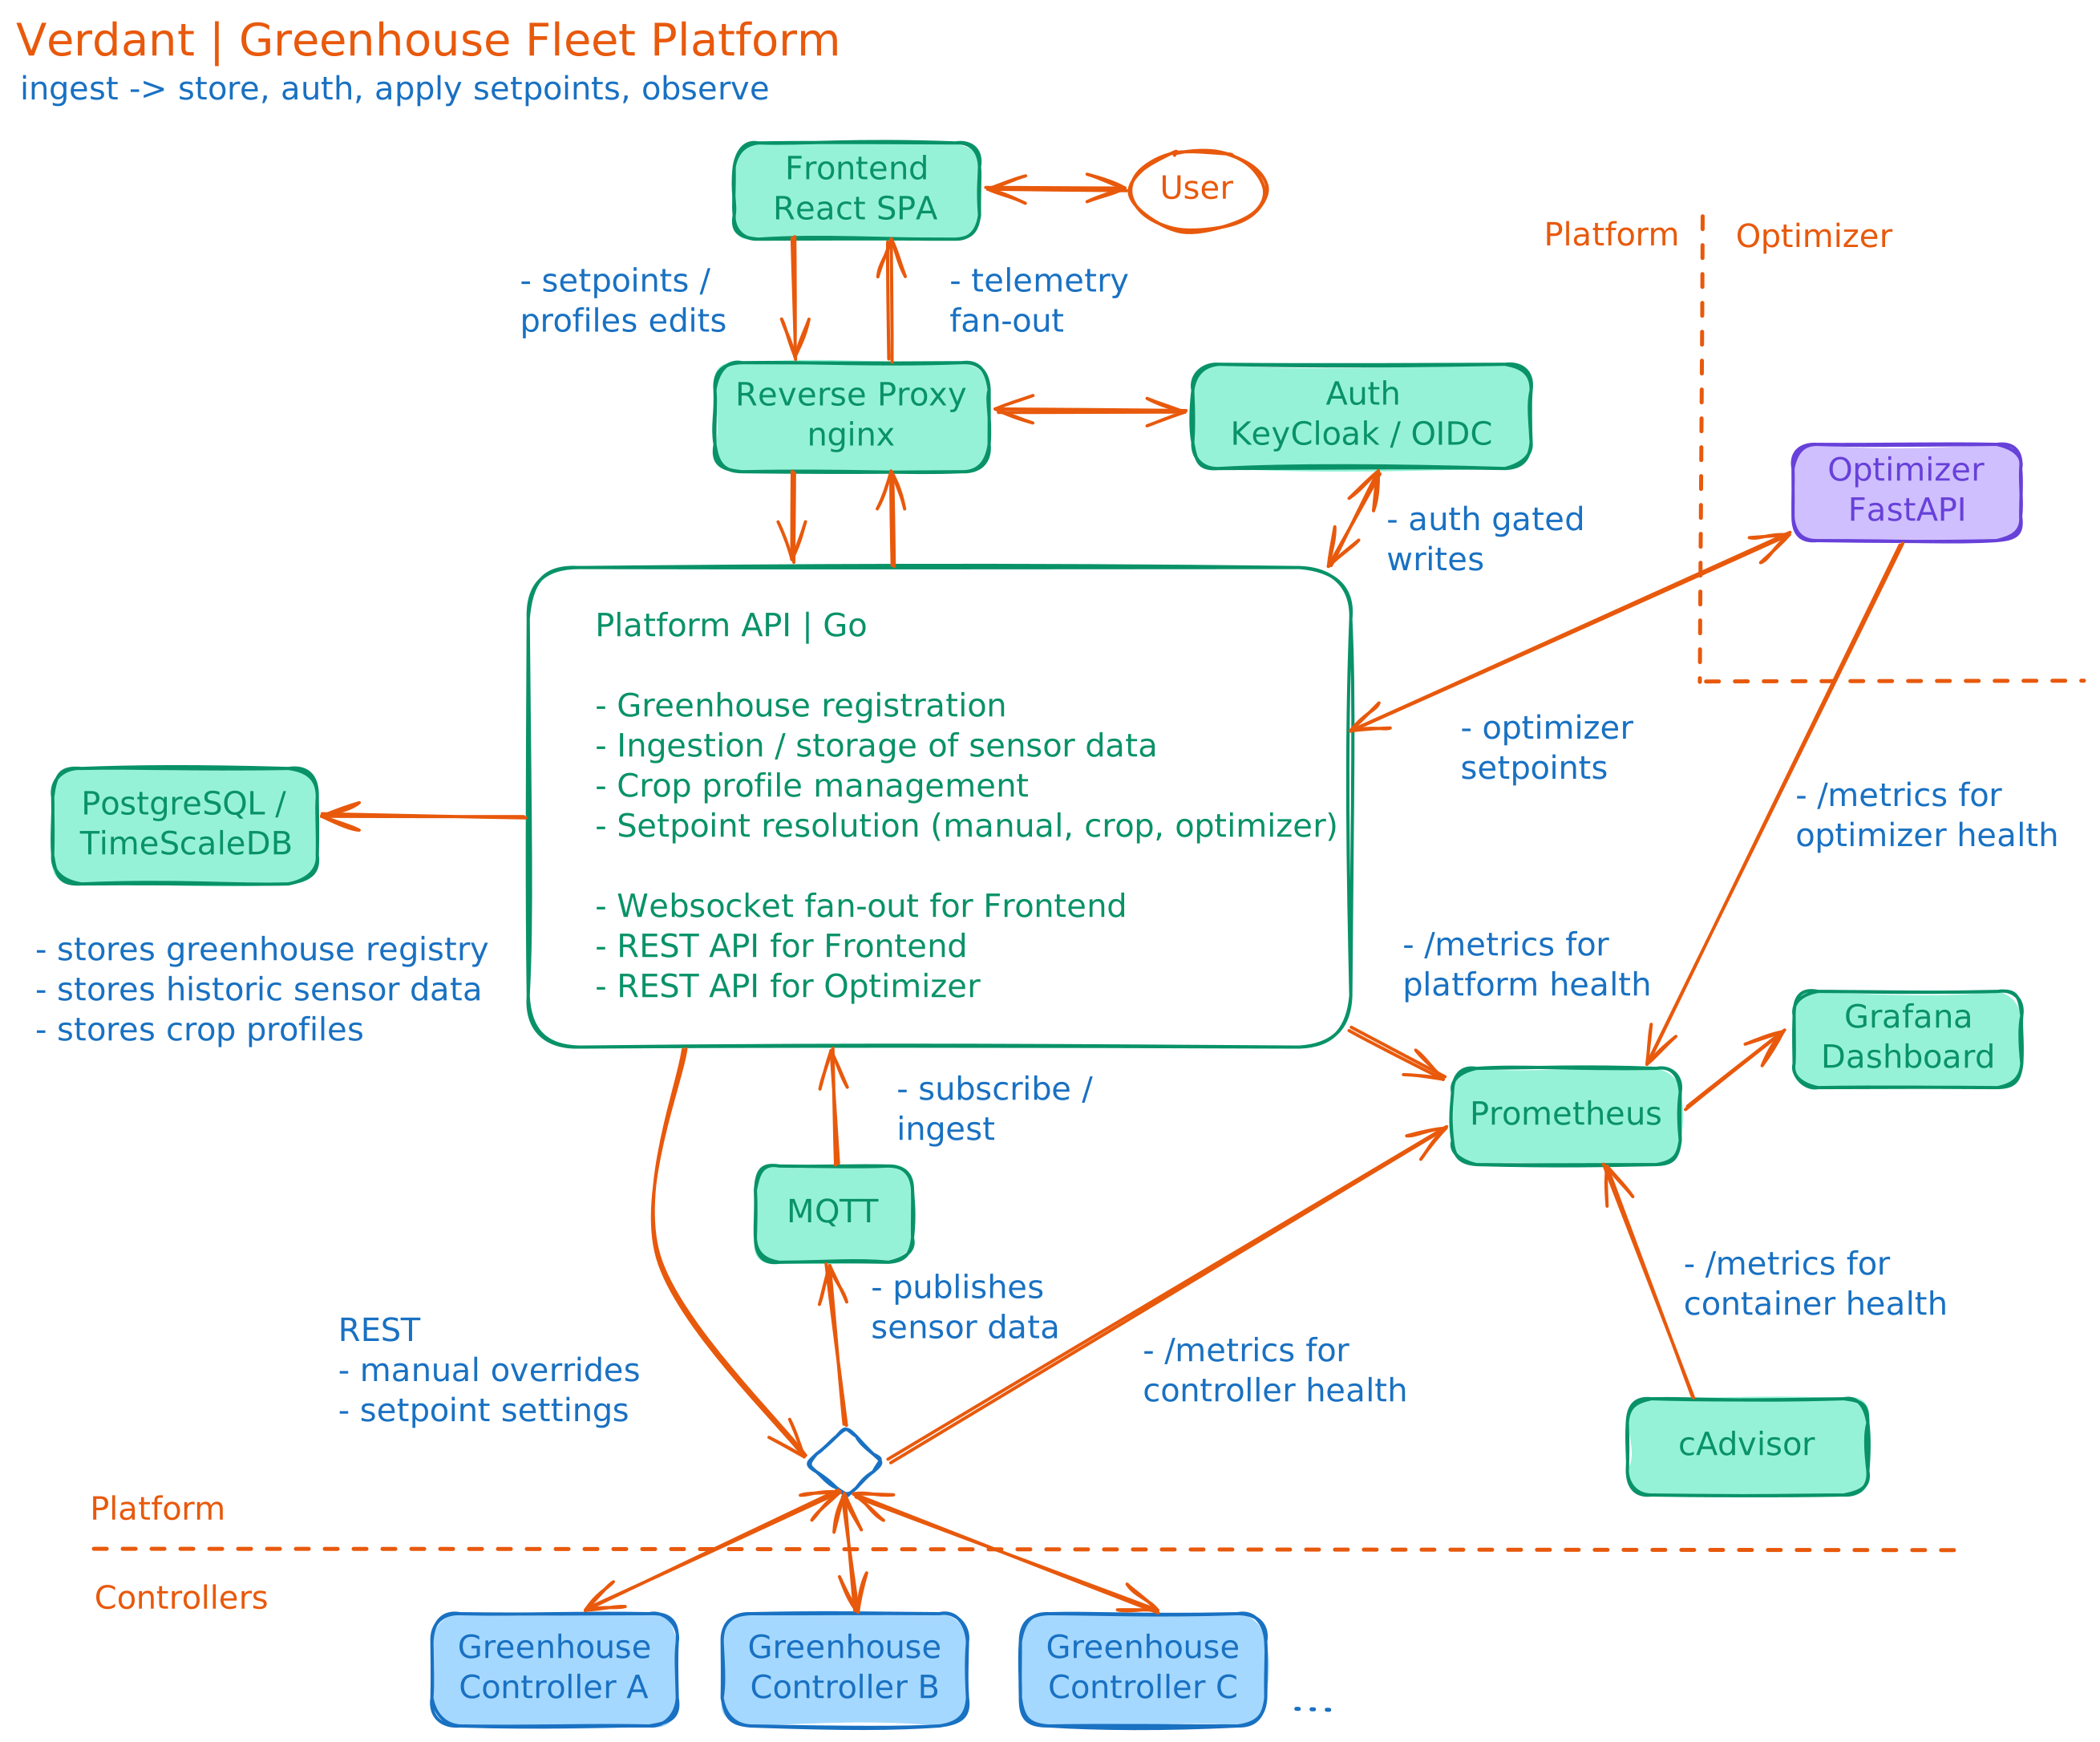
The three paths have deliberately separate responsibilities:
- telemetry moves up from controllers to the platform over MQTT
- crop profiles, assignments, and approved setpoint changes move down over REST
- the dashboard reads and operates the fleet through the platform API only
The browser never speaks directly to MQTT or a controller, and controllers never depend on the platform for their local control loop. That keeps the interface useful without turning it into a hidden dependency for crop protection.
Crop Profiles Become Reconciled Intended State
A profile is a named, stage-aware set of climate and irrigation targets. When an operator assigns a profile and growth stage to a greenhouse, the platform resolves that intent into the numeric setpoint bundle that greenhouse should receive. An ad-hoc operator edit can layer onto that state, and every downward change is recorded with its source and time.
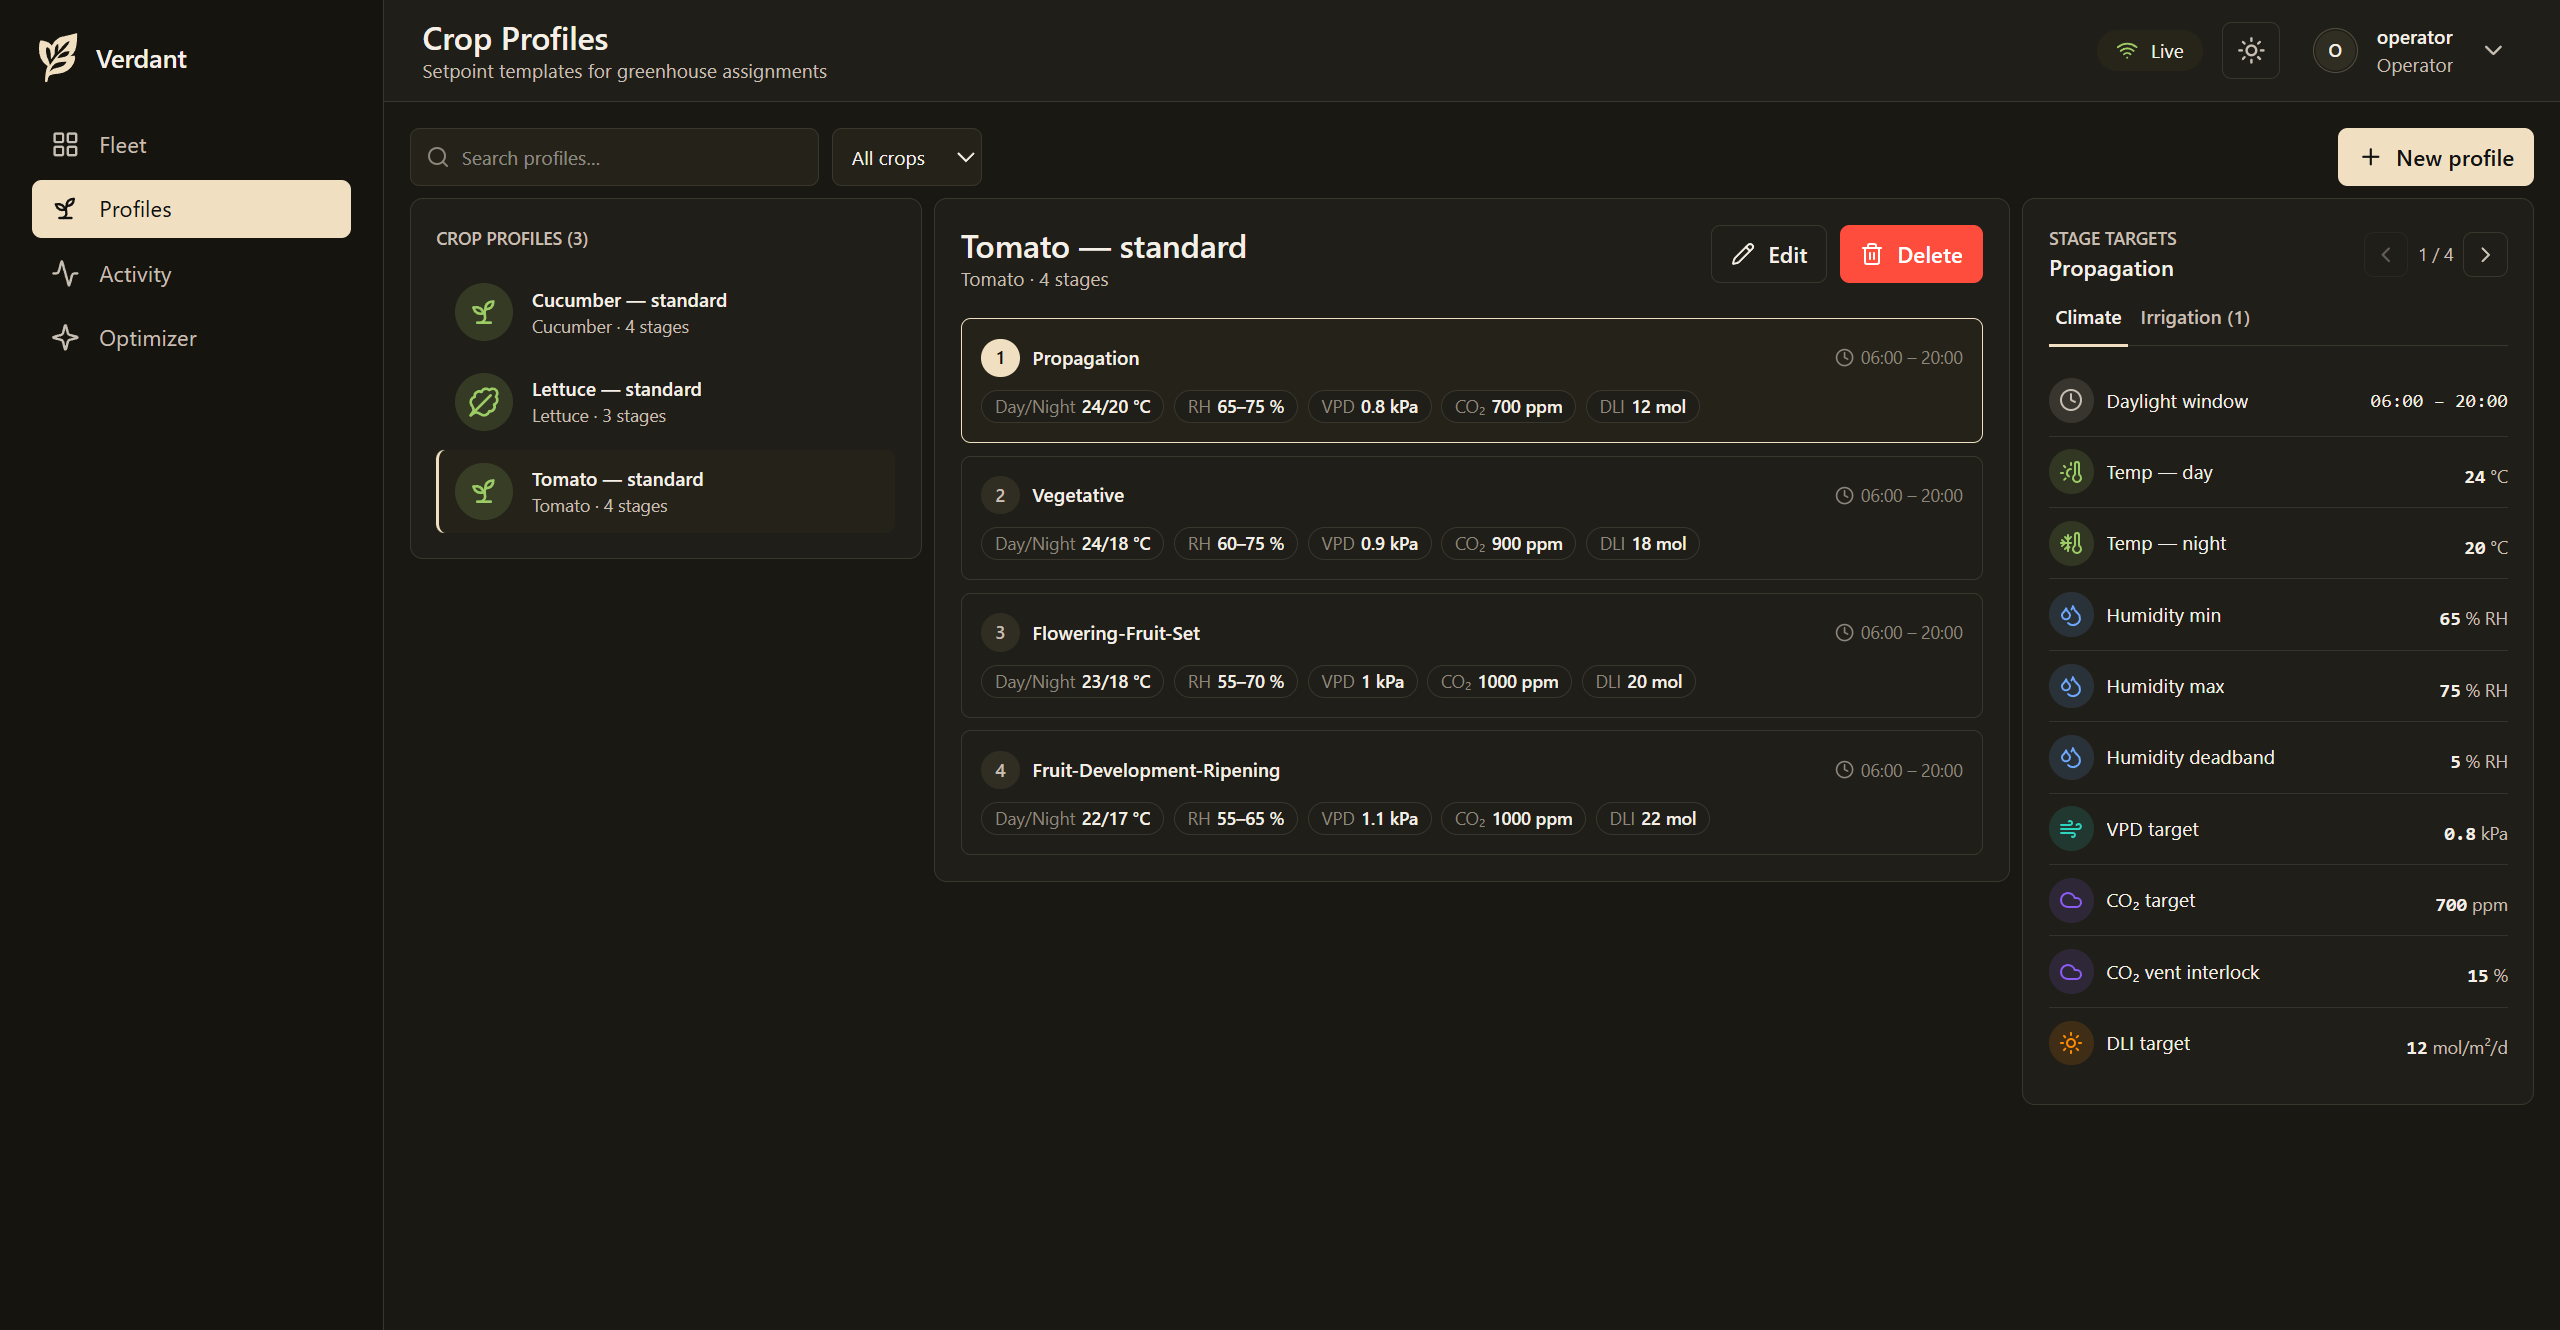
The delivery path is designed to converge rather than fire once and forget:
profile + stage / operator edit
           v
resolved intended state + provenance
           v
deliver to greenhouse --> compare reported state --> re-assert or surface drift
If a greenhouse is offline when intent changes, the platform holds the change. When it returns, reconciliation reasserts the intended state. Repeated delivery is idempotent, reconnect work is staggered, and recurring failures are rate-limited and visible to the operator instead of being retried indefinitely.
A Deliberate Boundary With the Controller and Optimizer
The platform works with two adjacent products while keeping their responsibilities separate:
| Component | How the platform works with it | Boundary |
|---|---|---|
| Climate controller | Ingests its telemetry and delivers the platform’s intended setpoints through its REST API. | The platform never commands individual actuators or overrides local safety behavior. |
| Climate optimizer | Provides bounded planning context and accepts its proposed setpoint refinements through the same platform write path. | The optimizer never connects to a controller directly; the platform validates accepted refinements against the active crop-safe envelope. |
This makes the platform the single setpoint authority. It can show controller health and optimizer activity in one place, but it does not absorb either product’s detailed control or planning responsibility.
Activity Feed and Observability
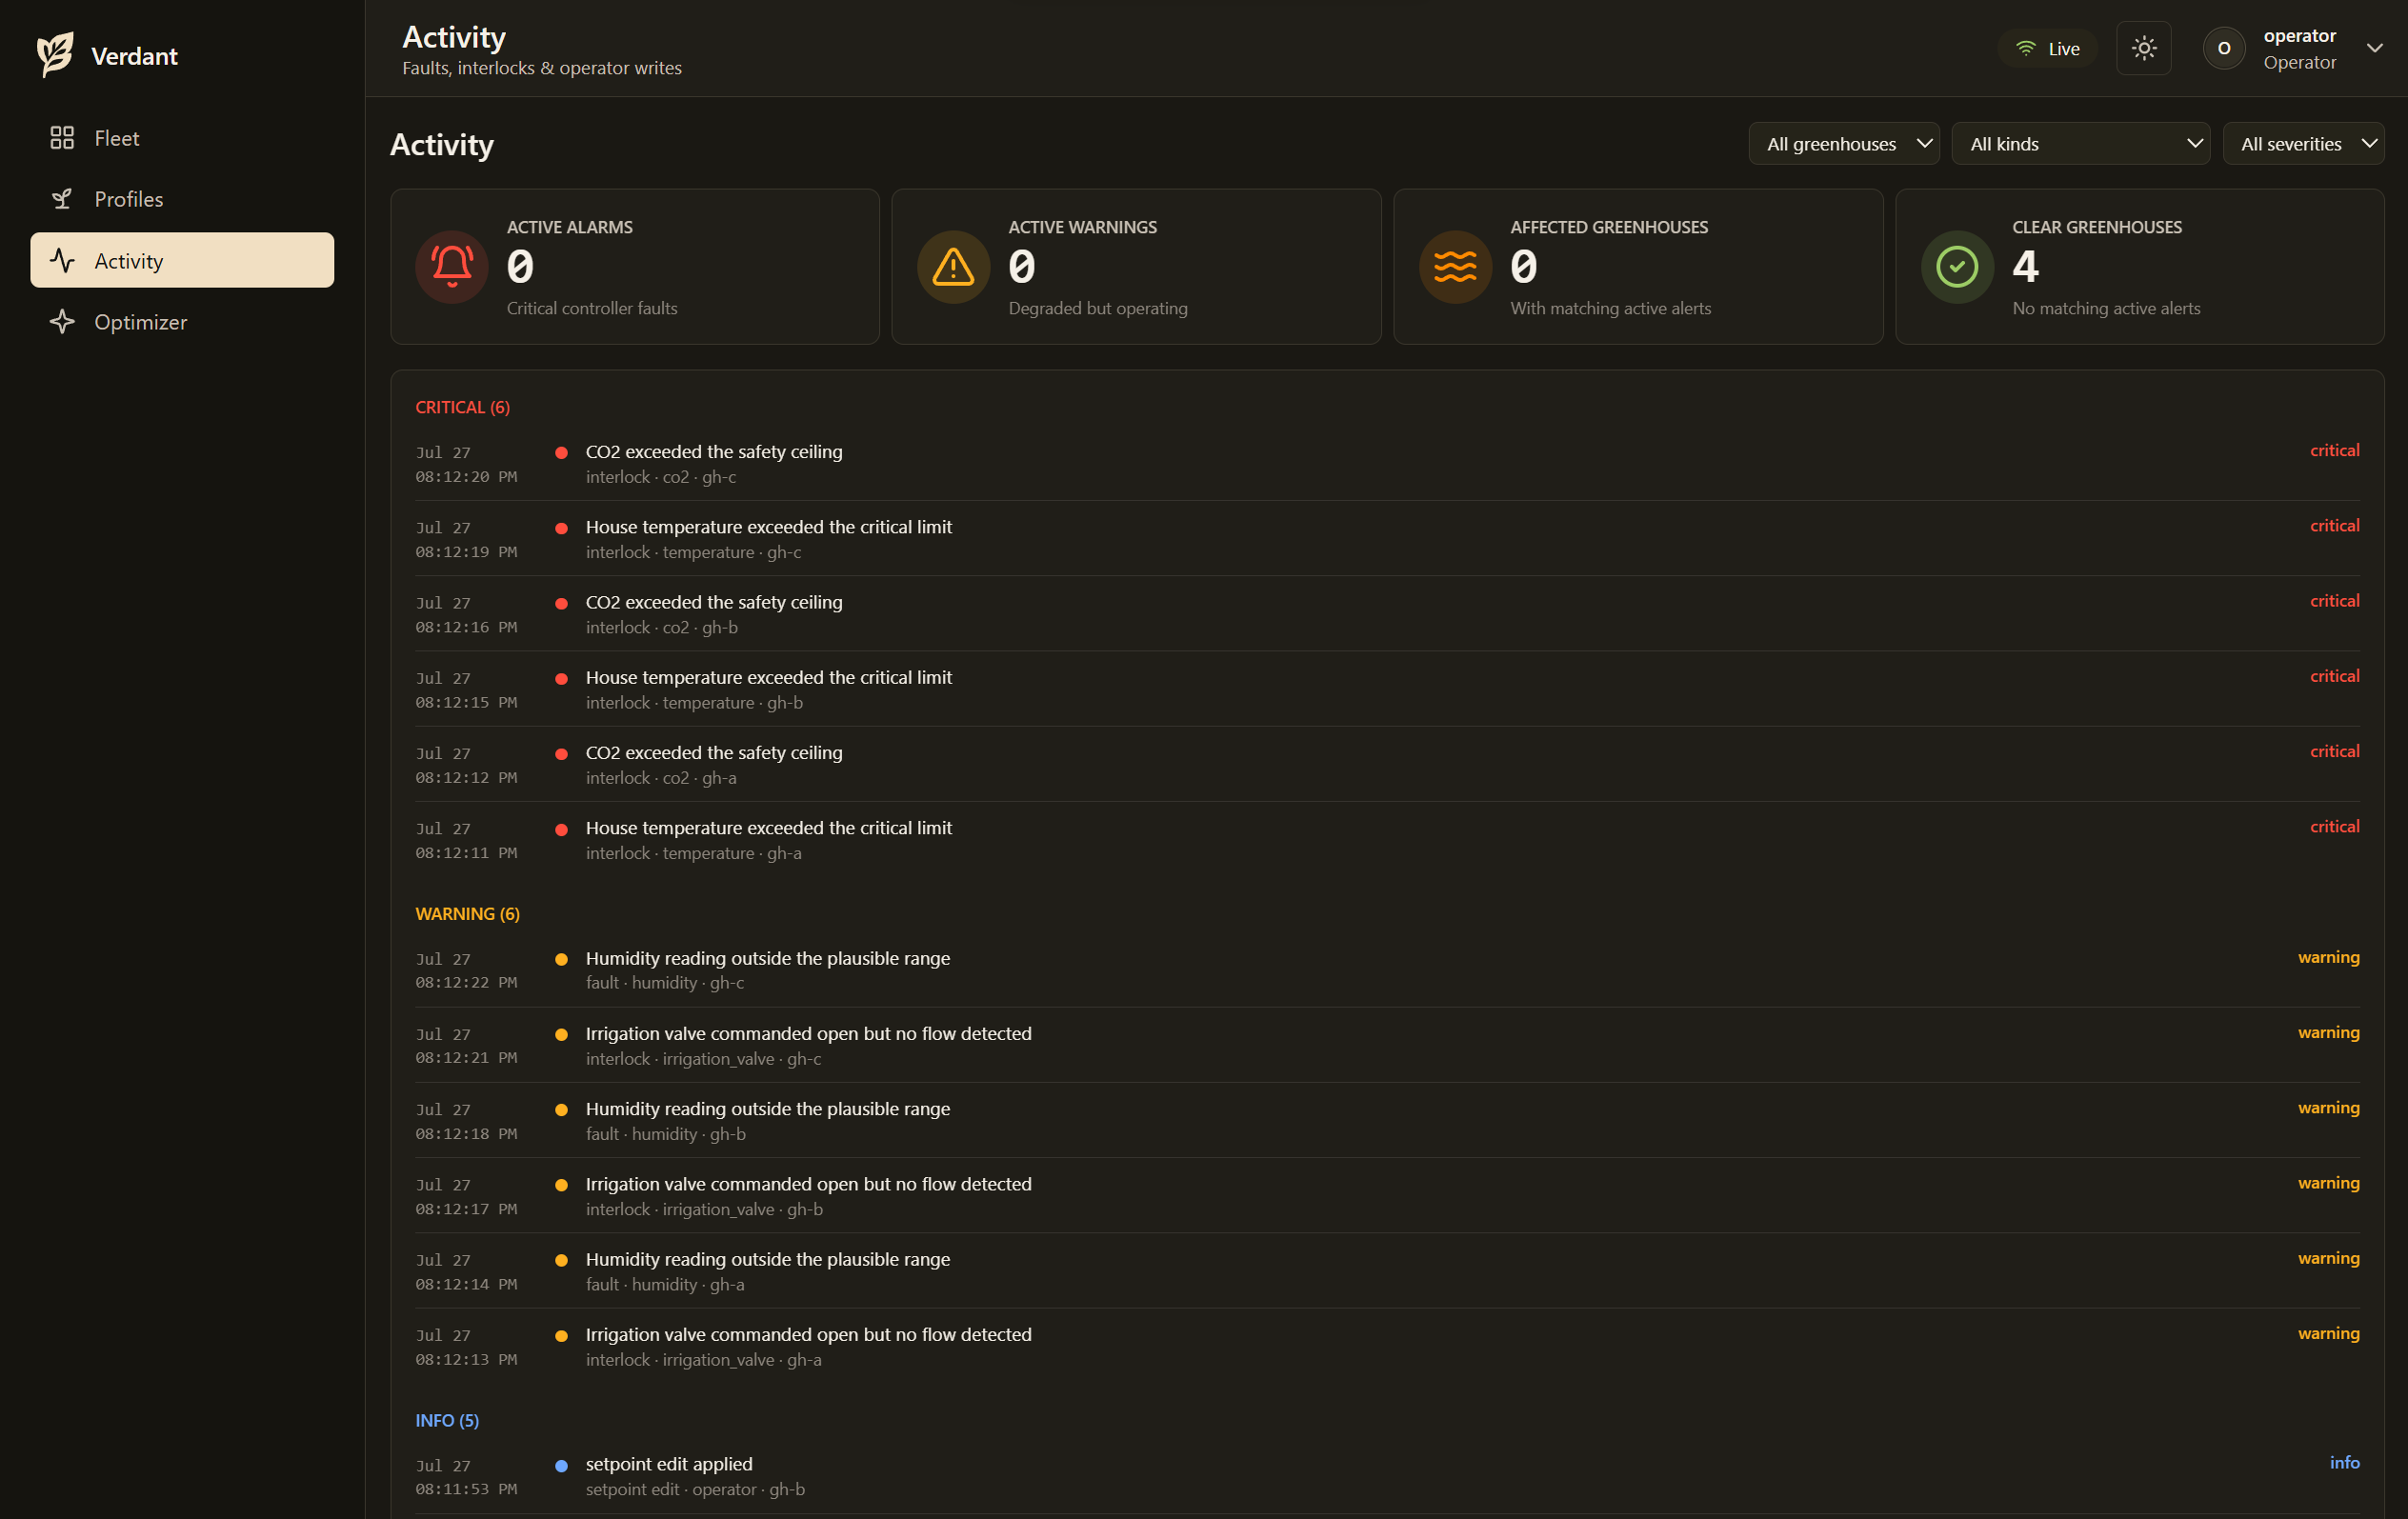
The activity feed records faults, interlocks, setpoint edits, profile applications, and drift with greenhouse, timestamp, severity, and source. It is filterable and updates live over WebSockets, giving operators a concise audit trail for every important change.
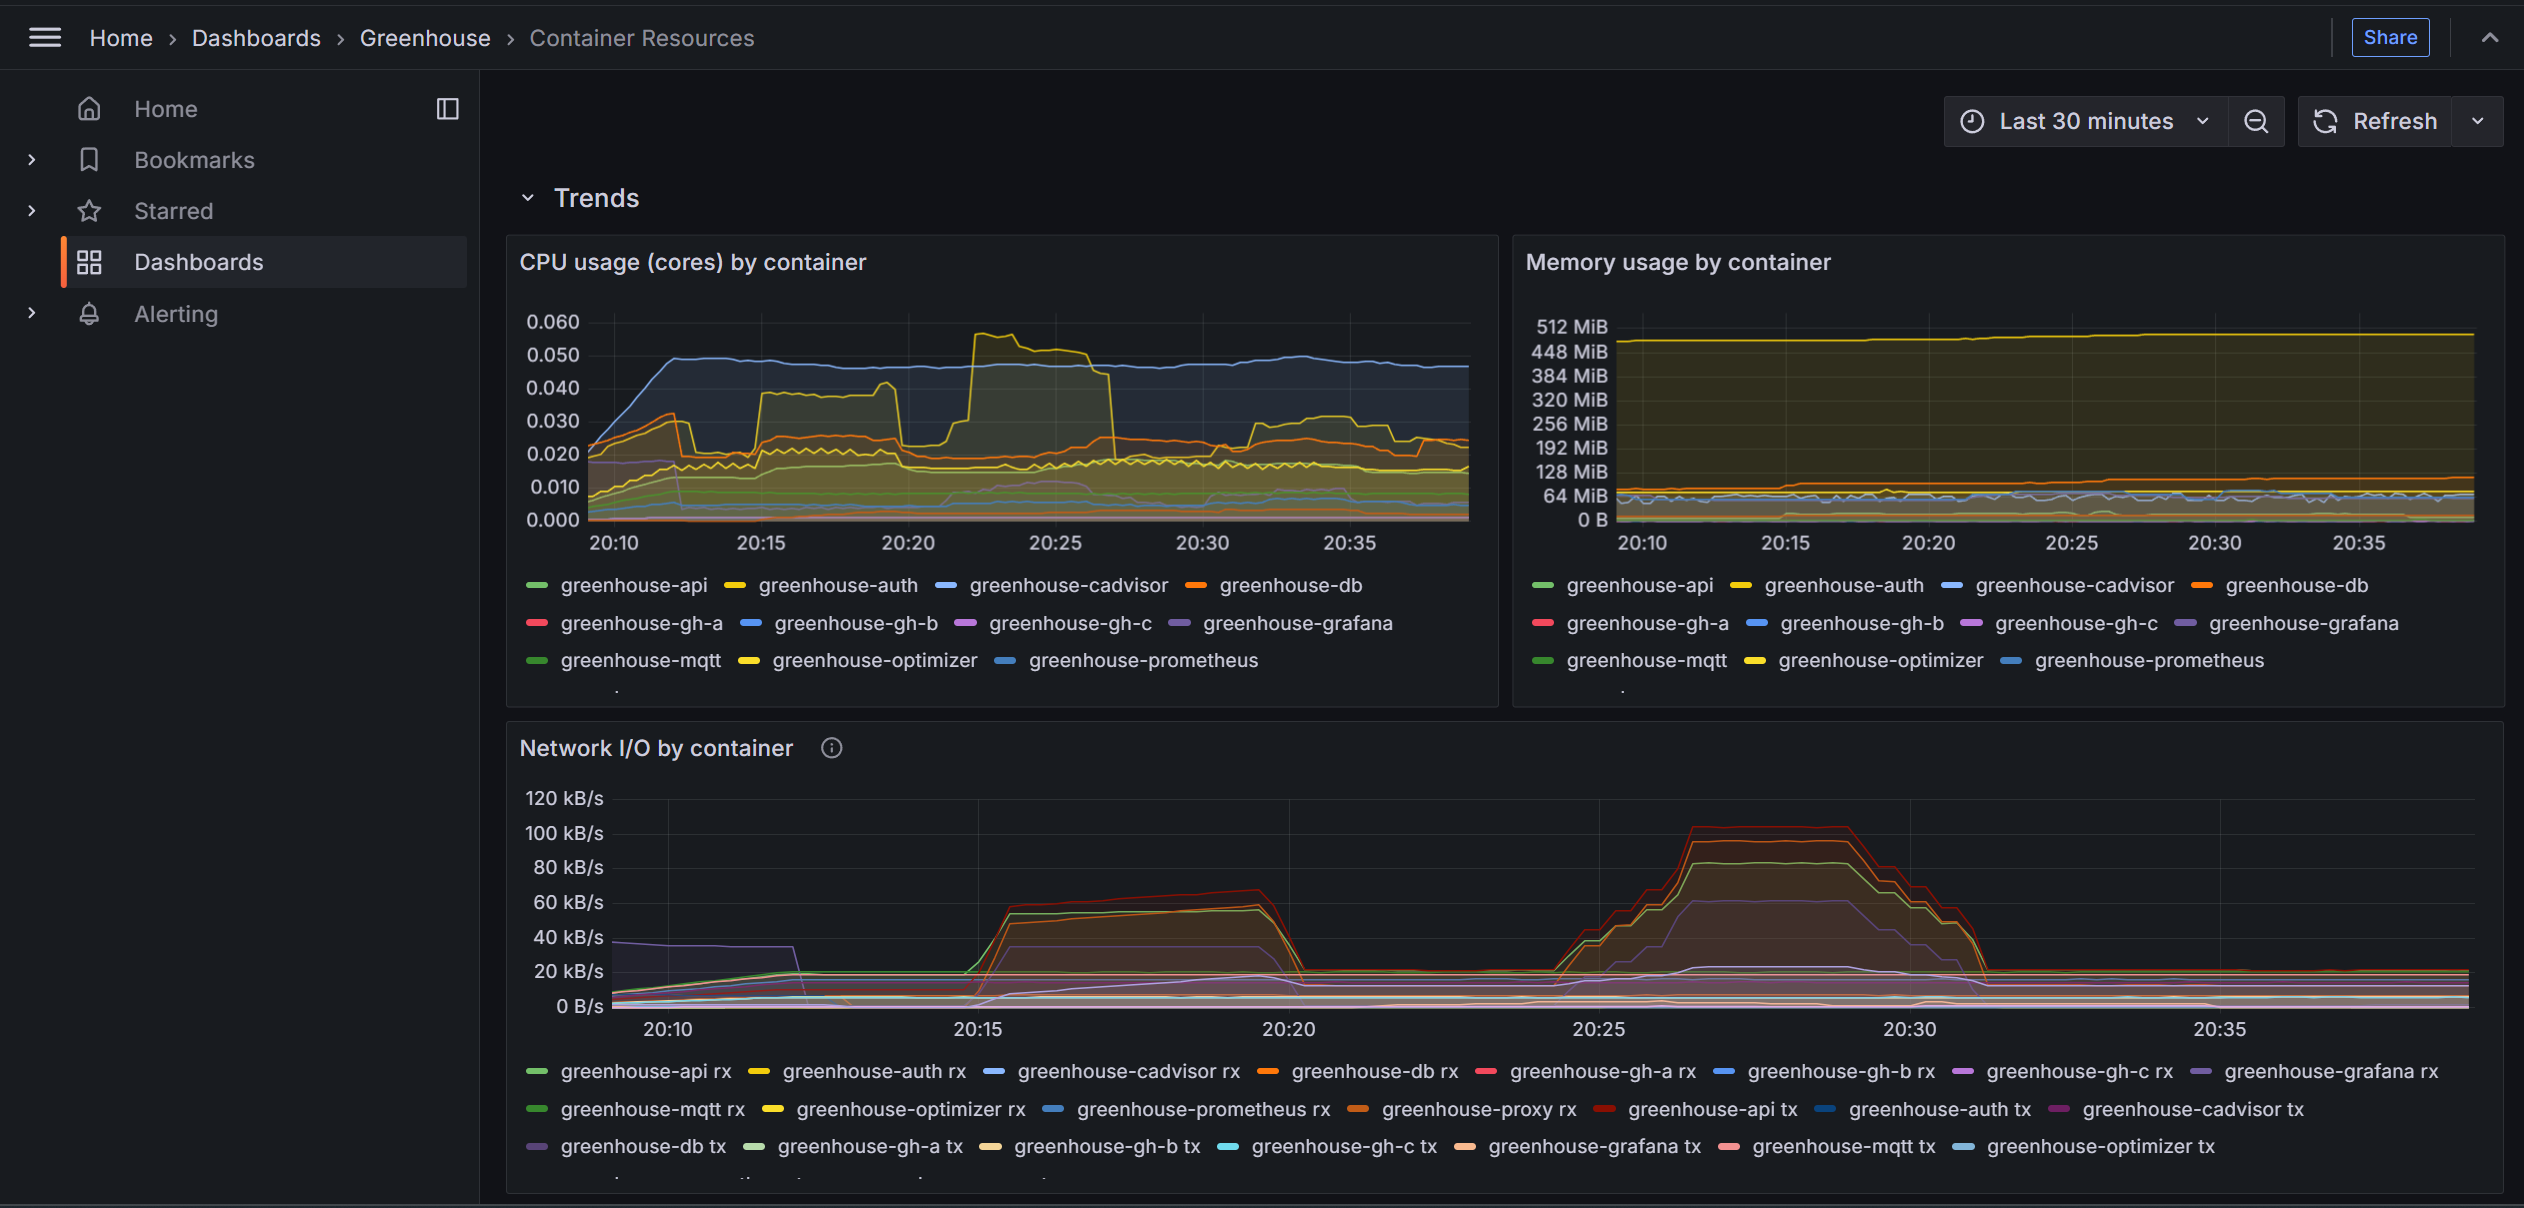
Platform observability stays separate from crop telemetry. Prometheus and Grafana
track ingestion, dropped frames, API latency, reconciliation, connectivity, and
datastore health alongside controller metrics. Structured slog entries preserve
the provenance of every downward setpoint write.
Architectural Tradeoffs
| Choice | Why it fit | Tradeoff |
|---|---|---|
| One Go API hub | It centralizes identity mapping, setpoint authority, dashboard APIs, and reconciliation in one cohesive platform service. | Ingestion, persistence, and live fan-out share a process failure domain, so each uses bounded internal channels. |
| MQTT up / REST down | Telemetry can fan out independently while setpoint delivery remains explicit, authenticated, and traceable. | Two integration paths require clear contracts and reconciliation logic. |
| Intended state with reconciliation | The operator can trust that a change survives an offline controller and that configuration drift becomes visible. | More state and delivery logic than a simple relay. |
| TimescaleDB for telemetry | Time-bucketed analytics and retention are first-class alongside relational fleet and profile data. | The platform carries database operations and migration complexity. |
| Platform-only optimizer integration | It preserves a single audited setpoint path and lets the platform enforce crop-safe bounds. | The optimizer cannot take a shortcut around platform availability. |
Outcome
The finished platform turns a set of independent greenhouses into an operable fleet. It provides a live fleet overview, greenhouse detail views, telemetry history, crop-profile management, attributed activity, and a durable reconciliation path for setpoint intent. Its cloud-native operating model stays portable across cloud environments rather than depending on any one provider (aws/azure/gcp).
It delivers:
- a single dashboard and API for fleet registration, health, and live status
- durable telemetry history and live WebSocket updates
- crop and growth-stage profiles resolved into greenhouse-specific targets
- intended-state provenance, offline delivery, reconnect re-assertion, and drift surfacing
- a setpoint-only interface to the controller, preserving its local authority
- one validated, auditable platform path for optimizer refinements
The key outcome is operational trust: the platform makes every greenhouse’s state, intent, and delivery status visible without taking over the local systems that keep the crop safe.
Code entry points
github.com/brokhuli/greenhouse-climate-controller
-
climate-platform/cmd/api/main.go— Platform service entry point -
climate-platform/internal/ingest/ingest.go— MQTT telemetry ingestion -
climate-platform/internal/api/profiles.go— Crop-profile and assignment API -
climate-platform/internal/reconcile/reconcile.go— Intended-state reconciliation -
climate-platform/internal/store/telemetry.go— Time-series telemetry store -
climate-platform/internal/ws/hub.go— Live dashboard fan-out -
climate-platform/test— Platform integration tests